
Key Points:
• The B word gets thrown around a lot and given the exceptional run up in AI related names, investors are rightly concerned about whether we are currently in a bubble.
• Although valuations are high, they are not extreme, and the rally in AI related names has been supported by strong earnings. The valuation of the median stock in the index is around normal.
• The key to whether this is a bubble is earnings. If earnings hold up against consensus expectations, it’s hard to imagine a significant valuation driven de-rating.
• This differs meaningfully from the Tech Bubble, where multiples rose in the absence of meaningful realised earnings growth.
• The key risks to earnings are if compute capex is slashed in the short term or if capex doesn’t generate sufficient return on investment (ROI).
There have been three catastrophic market drawdowns in long term investors’ living memory, the 1970s bear market, the Tech Bubble and the Financial Crisis. The 1970s bear market was driven by high inflation, interest rates, recession and a quadrupling of oil prices due to the Arab oil embargo. The Tech Bubble was burst by a massive unwind in valuations as the euphoria surrounding the internet evaporated in line with a lack of monetisation. The Financial Crisis featured a disorderly unwind of an over-leveraged financial and economic system. Out of the three, if history were to repeat the Tech Bubble is the most viable candidate. The US – Iran deal has taken a quadrupling of oil prices off the table, and energy spend is a much smaller part of the economy than in the 1970s anyway so the global economy is less sensitive to oil shocks. The financial system is nowhere near as leveraged now (outside of China) as in 2006/07 and higher capital requirements and tighter bank regulation have reduced the risk of a Financial Crisis repeat. However, market valuations are high and anything AI related looks frothy. It stands to reason that investors would be concerned about a repeat of the Tech Bubble. With that in mind, in this month’s Market Insight, we assess the prospects of a repeat. Are we in a bubble, and if yes, what would cause it to burst?
Valuation
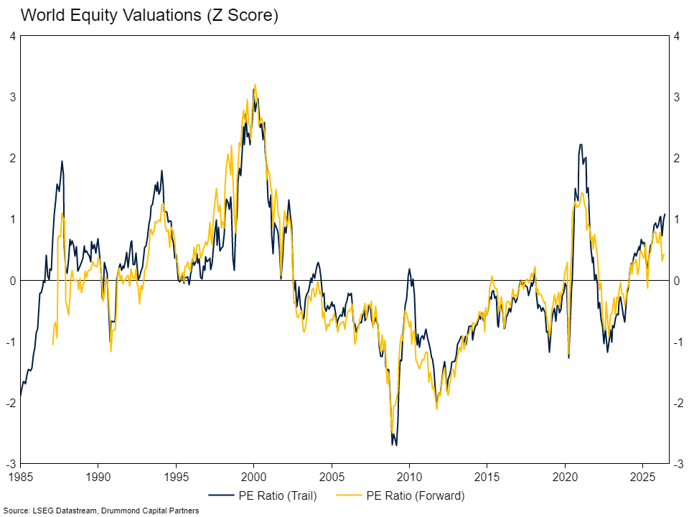
Valuations are not cheap, but they aren’t necessarily extreme either. The global equity market sits between a little stretched (from a price to forward earnings perspective) to extremely expensive (from a price to book perspective). Across regions, the US and Australian markets are the more expensive, emerging markets (EM) and Europe are around normal. Looking at the chart below, whether the current episode risks a repeat of the Tech Bubble really depends on which line you focus on. In the Tech Bubble, all valuation metrics were expensive, at around 3 standard deviations above average. Price to forward earnings (next year’s earnings) and price to trail (last year’s earnings) are meaningfully lower than in 2000, and meaningfully lower than in 2021. This time around there is also significant dispersion within the market with respect to valuations. The median PE for the S&P 500 is around 20% cheaper than the index as a whole. Expensive mega-cap technology and AI related companies are dragging overall index valuations higher but doing so in an environment of very strong earnings growth and profitability.
Different Segments, Different Story
So, let’s dive into the AI related complex, which represents around a third of the index and where valuations are clearly higher. The story is quite different across different segments, as are the risks. There are a few distinct groups to consider. At the pointiest end, we have the model builders, Anthropic (Claude) and OpenAI (ChatGPT) purchasing compute and looking to IPO at some point soon. These companies are likely to list at incredible valuations, but because of limited free float, aren’t expected to represent a huge weight in the index. They will be among the most valuable companies in the world, but index holders won’t own much of them. If it turns out that models will be commoditised, or training and inference costs can’t be monetised, valuations will fall, but it won’t take much down with it other than unrealised gains for their investors.
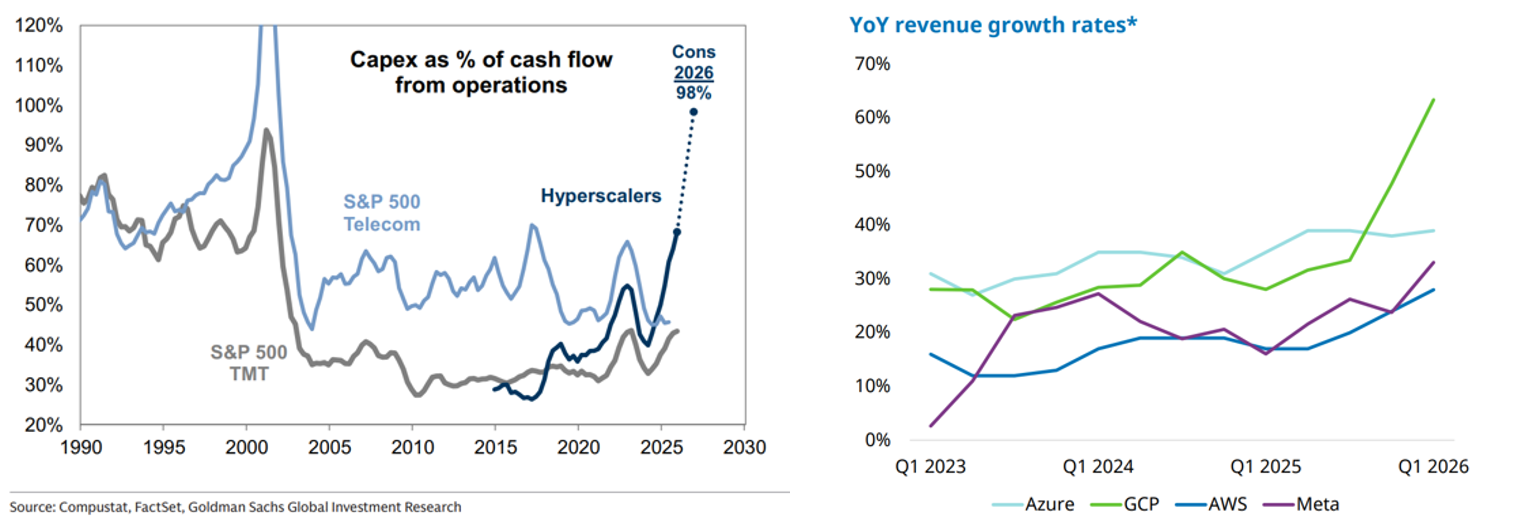
The next stage of the chain are the hyperscalers (Microsoft, Amazon, Google, Meta, Oracle) building the cloud compute capacity. Massive investment will see these companies move from generating high levels of free cash flow and no debt, to issuing new equity and raising debt to fund the huge investment pipeline. This year the hyperscaler capex is set to reach ~US$757bn (up 84%) and somewhere between US$0.9tn and US$1.4tn in 2027. The capex itself is globally meaningful, at ~1.5% of GDP. For comparison, the railroad and electrification buildouts represented around 2-3% of GDP.
At any rate, the valuation risk from these businesses isn’t the problem. Hyperscalers as a group are trading slightly below long run average valuations. Probably in large part due to an expectation of reduced profitability due to the large capital investment they are making which will reduce their return on equity (ROE).
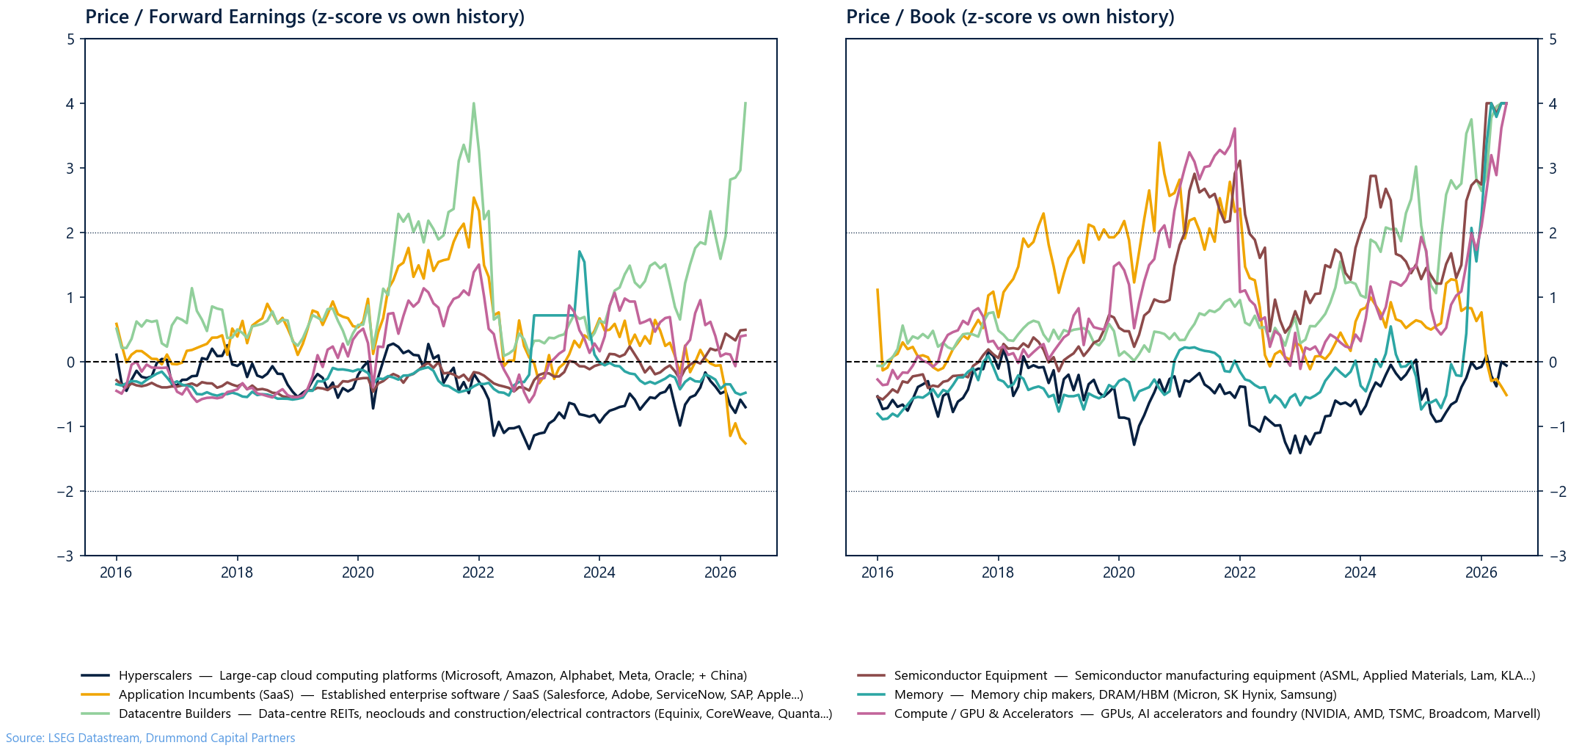
The next group in the chain are the picks and shovel providers, which anyone following the market would know have gone ballistic in recent periods. This has left names in the memory, compute/GPUs and semiconductor equipment all extremely expensive relative to their history – but for the most part only from a price to book perspective. Exceptional realised and expected earnings across the AI hardware spectrum means they are 4 standard deviations expensive relative to their book value, but fair value relative to their earnings. Less directly related segments have also seen their valuations carried higher. Datacentre builders are expensive on both metrics. Power and electrical equipment and power generators have seen solid earnings growth but are also trading at 3 standard deviations high from a price to book perspective.
The other key AI thematic has gone the other direction. SaaS businesses are cheap relative to history with the market worried that everyone can now vibecode their own version of Salesforce. As we have noted in previous blogs, we think the bear case here is materially overstated, but cheap versus their own history isn’t cheap in an absolute sense and they are still trading at mid-20s trailing earnings even after the sell-off. That said, an underappreciated aspect of agentic coding for SaaS incumbents is their ability to cost out development costs. If you think AI has turned your nephew at university into a great coder because of the nice website or app they have built, imagine what it has done to a senior software developer in an established software business.
Earnings, Earnings, Earnings
The divergence across valuation metrics for global equities and different AI segments is interesting and poses probably the most fundamental question of this whole exercise: will the current level of corporate earnings be sustained, and can corporate earnings continue to grow at rude rates? If the answer is yes, there is no bubble and current PE ratios represent a good approximation of the price you are paying for the market. If the answer is no, then price to book is a better comparator and there isn’t a lot to hold valuations where they currently are over the medium term for the more expensive parts of the market.
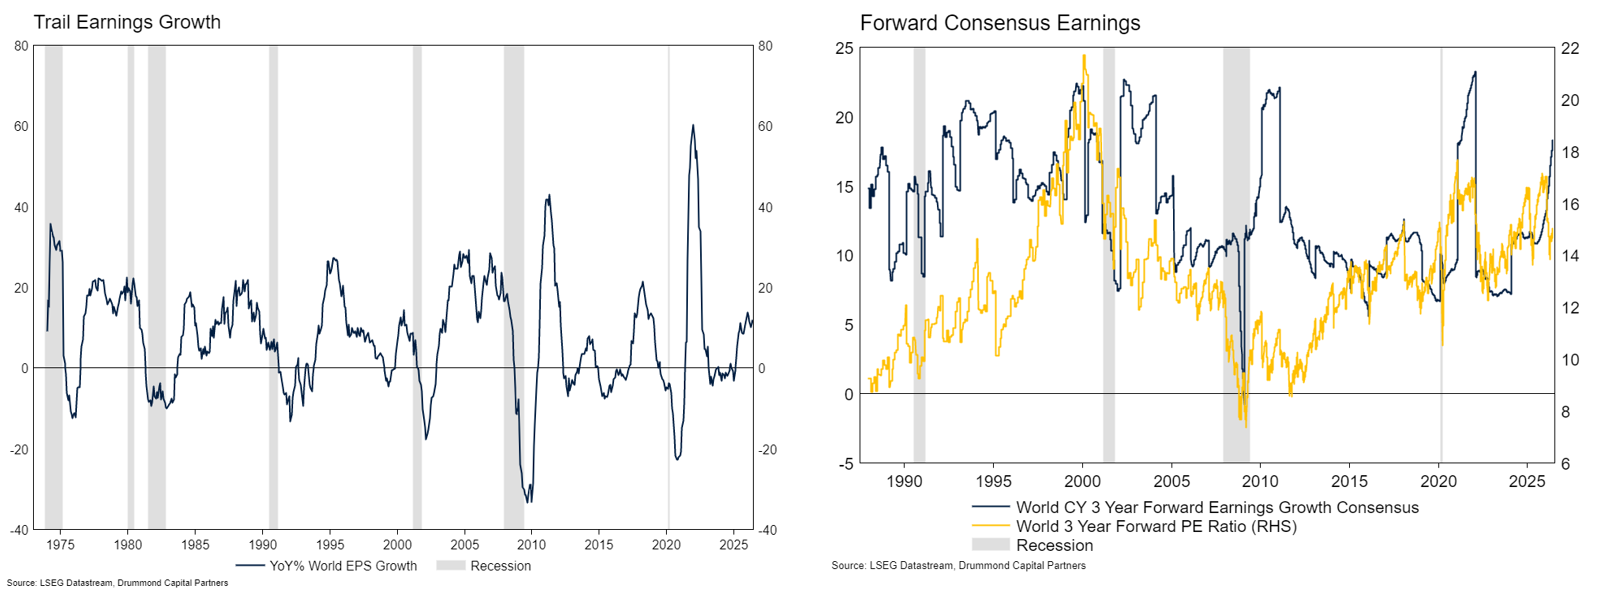
Earnings for the global equity market grew around 15% over the past year. US market earnings grew closer to 20%. The chart on the left below shows that is well within the norm. If anything, trail earnings growth is currently modest relative to cycle peaks. However, the chart on the right shows consensus forward earnings growth expectations and that’s where things get more interesting. At the moment, consensus expects 18% per annum earnings growth each year between now and calendar 2028 for world equities. That’s an exceptional forecast and doesn’t usually translate to the realised outcome. However, the other side of the coin, the price the market is paying for that consensus is much more reasonable – at 15 times 3Y forward earnings. The market was priced at 22 times 3Y forward earnings in the Tech Bubble. So – growth expectations are unusually high, but the price the market is paying for it is nowhere near bubble territory.
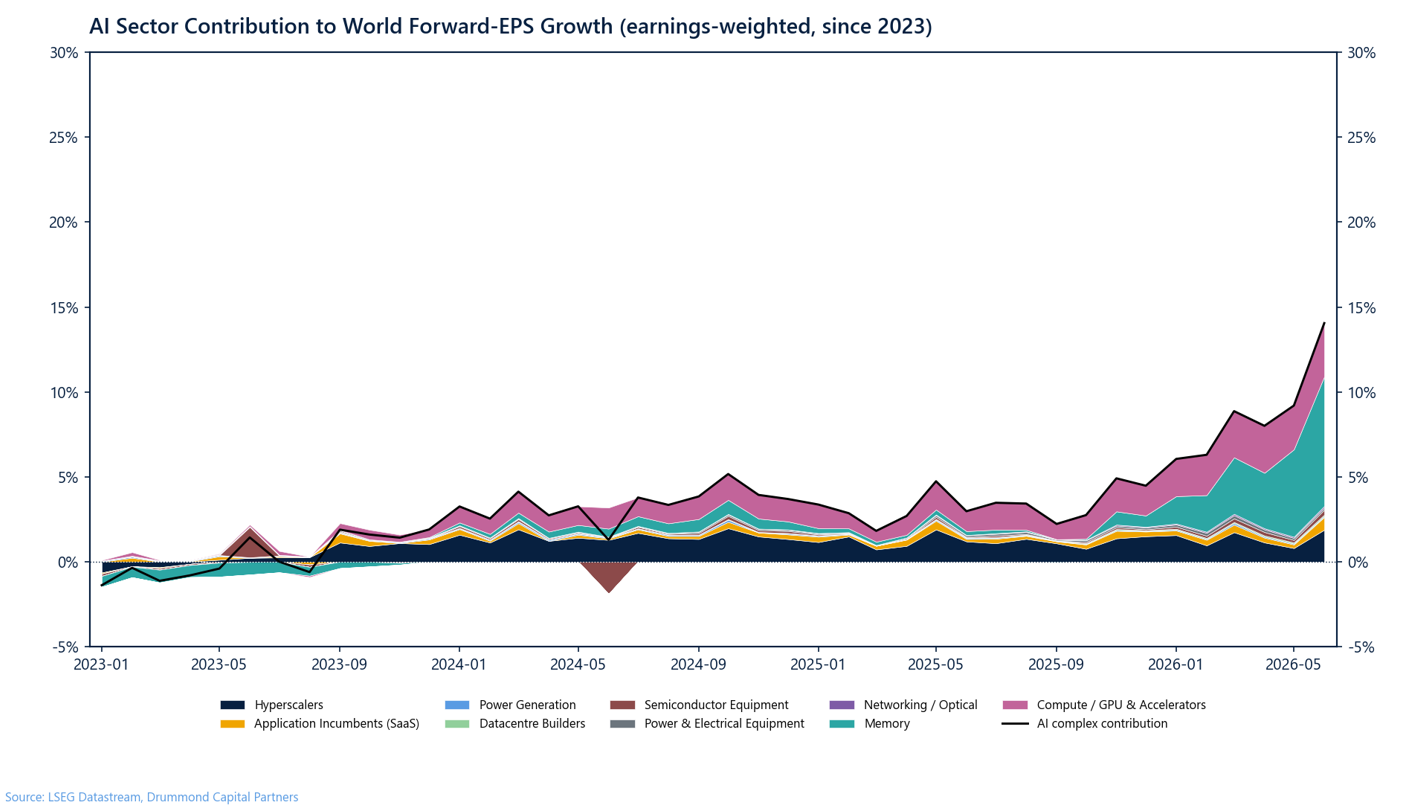
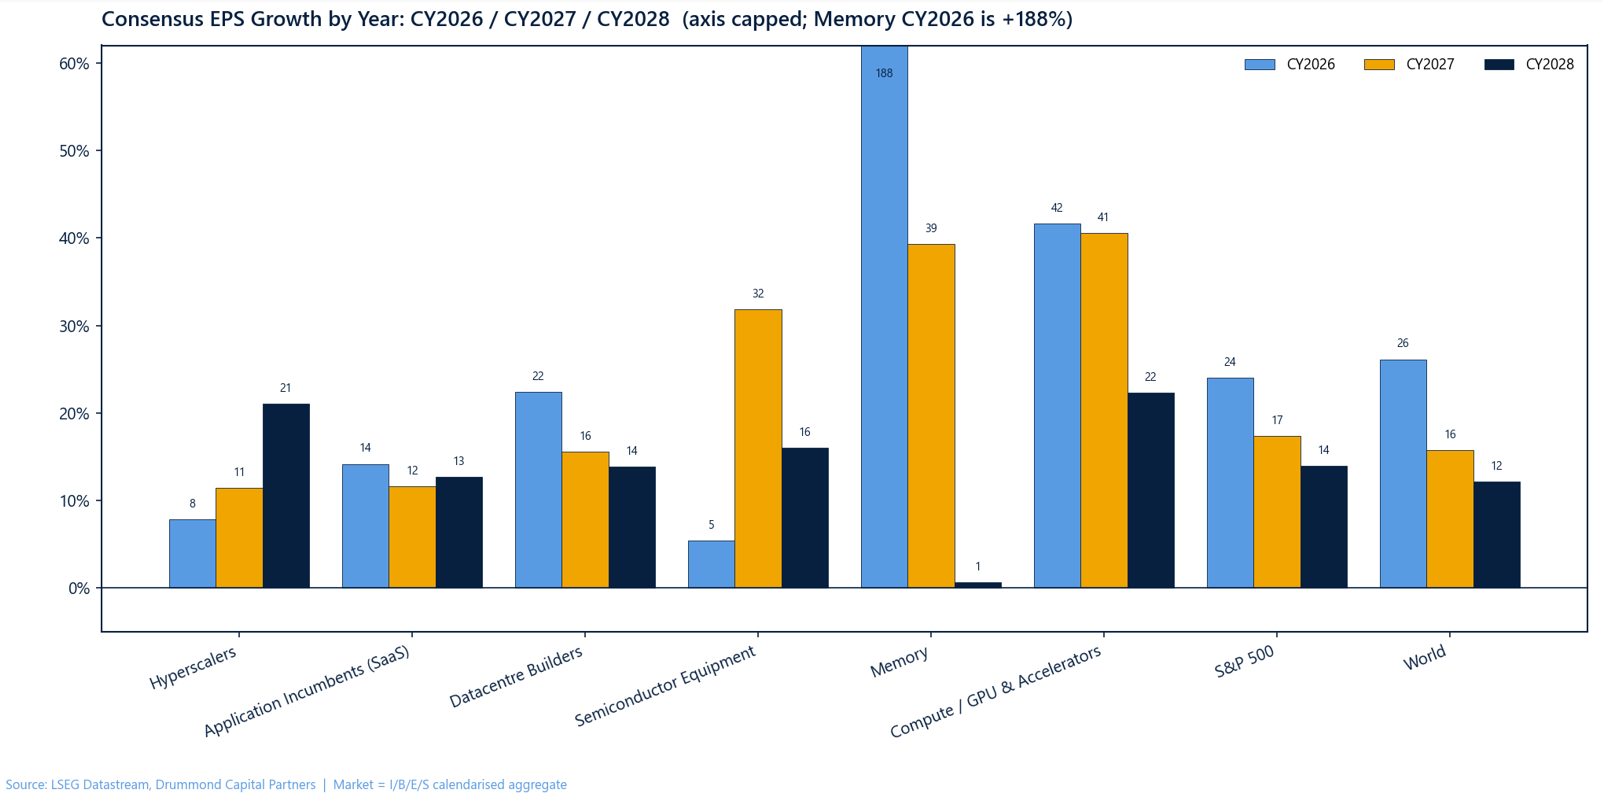
Of this, an enormous portion is directly related to the AI complex. The chart below shows the contribution to total forward index earnings growth from AI related sectors. Basically, over the next year the AI related part of the market is expected to contribute roughly 15 percentage points to index level earnings growth, approximately half of the markets expected earnings. The vast majority of this is expected to come from memory. This explains the massive valuation gap. Hyperscalers are still a meaningful contribution, but less than they were through 2024 and pretty small in comparison.
We can see this by segment and a bit further in the future in the chart below. Memory is the real 2026 story, and this is largely baked in. As supply comes online, memory earnings are expected to be flat in 2028. The Nvidia, Broadcom and TSMCs of the world are the second most exceptional group over the period, with an average growth rate of 35% expected over the next 3 years. Hyperscaler earnings growth is expected to accelerate into the forward years as ROI from capex comes online. Overall, the picture is optimistic, but not completely out of the realms of possibility.
It’s worth diving a little deeper into the hyperscalers here. Even though they aren’t expensive, they are the group funding the build out and are most on the hook if all the capex turns out to be a waste of money. Everyone else will have already been paid. You could only justify that kind of spend the hyperscalers are making with expectations of substantial segment growth from current levels – and to be fair that is exactly what has been happening. The below right chart shows revenue growth across major hyperscalers for their compute business lines. Thirty to forty percent growth rates justify a lot of investment. This isn’t all AI related inference and training costs (McKinsey estimate half of current compute is general cloud and half is AI related), even without AI the world needs more cloud compute.
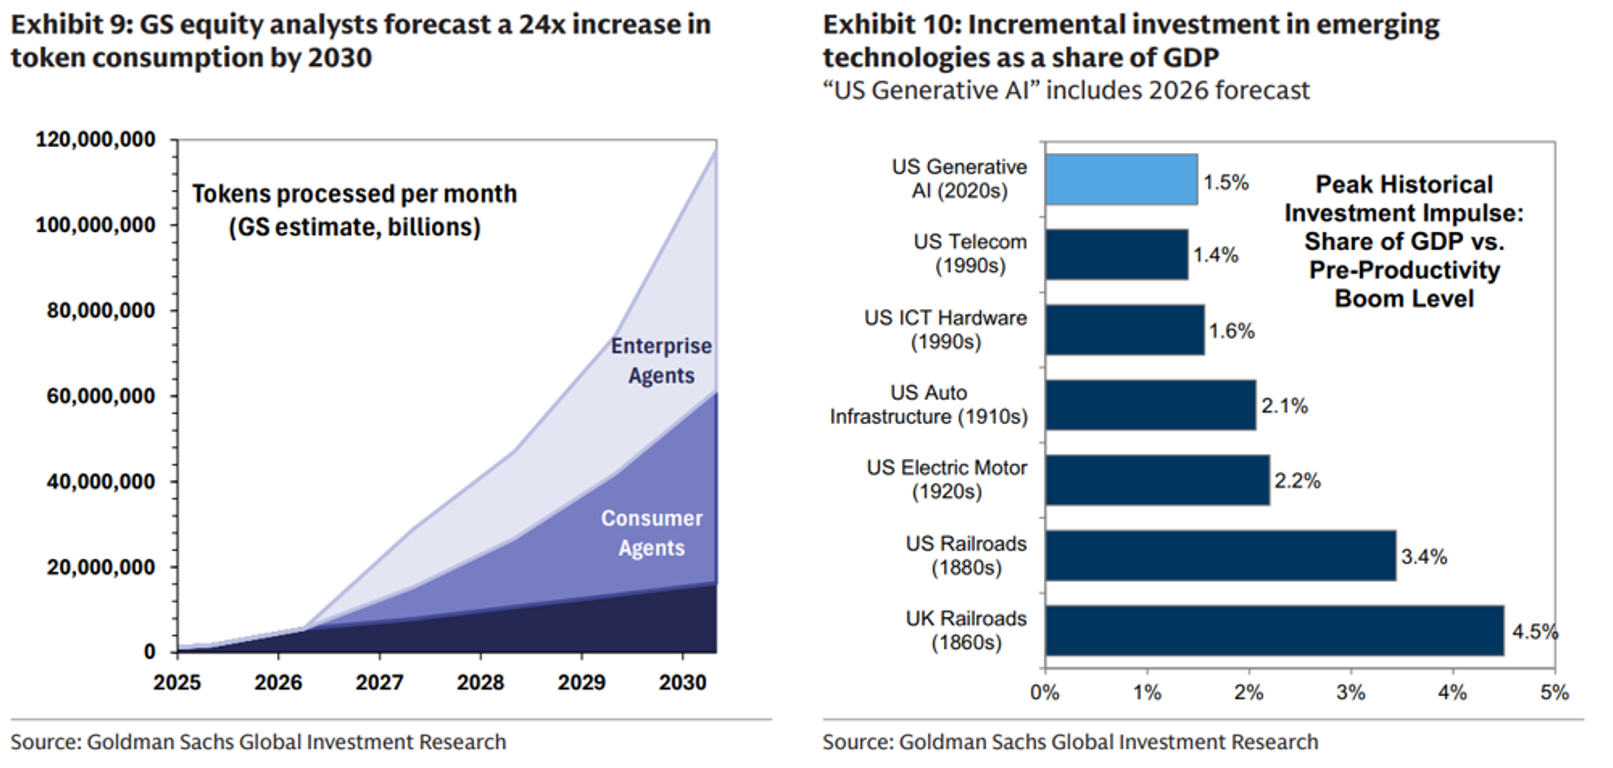
Structurally, it’s hard to imagine a future scenario where compute demand is lower than it is today. Even though current capex plans seem extreme, they are on the low end relative to other major global productivity infrastructure build outs (electricity, railroads, highways, see below, right). If AI does drive demand for tokens an order of magnitude greater than today in less than ten years’ time, the investment is necessary.
The primary risk is that the enterprise demand underwriting the whole buildout simply fails to show up. The capex thesis rests on a chain: hyperscalers build the compute, model providers and clouds rent it out, and enterprises buy enough AI product, at a high enough price, for that revenue to flow back up the stack and justify the spend. Assuming some required rate of return (and accounting for depreciation) at 30% revenue growth the breakeven for the investment doesn’t happen until the early 2030s. The gap will drag on earnings in the interim, however, beyond this point, and again assuming cloud demand grows, the earnings payoff on the other side should be substantial.
So, is it a bubble?
Is the market in a bubble? If it is, it’s nothing like the 2000s. Traditionally, a bubble is when price detaches from fundamentals. It’s hard to argue that is what has happened now when the price is being driven higher by exceptional earnings growth. In 2000, the market was three standard deviations expensive across every valuation measure. We are only part way there from a price to book perspective today. There is a lot resting on earnings growth forecasts over the next couple of years. A lot of that is front loaded. Consensus expects global earnings to grow 26% this year (half already in the bag), 16% next year and 12% in 2028. Those numbers are achievable absent a macroeconomic shock.
If this market has a bubble in it, it will not be pricked by valuation. It will be pricked by earnings disappointment that breaks the forward-growth assumptions. The main risk over the shorter term lies in the concentration of earnings in AI related hardware and compute providers. The hardware market is expected to be in shortage over the next year or two, but new capacity will come online eventually. If investment rolls over quickly and supply comes online, the hardware market should normalise shortly after.
The medium-term risk is whether hyperscaler capex begins to generate positive free cash flow again for investors. Even though these names have derated lower and aren’t expensive relative to the other parts of the AI complex, the sheer weight of market cap here warrants caution. Ultimately, it’s all earnings. Earnings have driven the market higher and if earnings disappoint materially, the market will derate lower.
Portfolio Positioning
Our portfolios are currently neutral growth exposure, though we have balanced our index exposure with exposure to non-AI related equity styles and regions. Bubbles can take a long time to inflate and there is no rush to do anything even if that was our central case. If this is a bubble and the market is going to rise to three standard deviations expensive, as in the last Tech Bubble, there is a lot of upside before a downswing. If earnings growth continues to meet expectations, then the market will continue to move higher and participating in that lift is the correct decision. Rather than reducing growth exposure because of bubble risk today we think a more prudent approach is to keep a keen eye on realised and consensus earnings growth. Earnings have anchored the market, and it won’t rerate lower unless earnings expectations do.
Prepared by Drummond Capital Partners (Drummond) ABN 15 622 660 182, AFSL 534213. It is exclusively for use for Drummond clients and should not be relied on for any other person. Any advice or information contained in this report is limited to General Advice for Wholesale clients only.
The information, opinions, estimates and forecasts contained are current at the time of this document and are subject to change without prior notification. This information is not considered a recommendation to purchase, sell or hold any financial product. The information in this document does not take account of your objectives, financial situation or needs. Before acting on this information recipients should consider whether it is appropriate to their situation. We recommend obtaining personal financial, legal and taxation advice before making any financial investment decision. To the extent permitted by law, Drummond does not accept responsibility for errors or misstatements of any nature, irrespective of how these may arise, nor will it be liable for any loss or damage suffered as a result of any reliance on the information included in this document. Past performance is not a reliable indicator of future performance.
This report is based on information obtained from sources believed to be reliable, we do not make any representation or warranty that it is accurate, complete or up to date. Any opinions contained herein are reasonably held at the time of completion and are subject to change without notice.


-p-500.png)